GeoAIR_icon

iTRELISmap: an interactive web map app for connecting and collaborating among/with TRELISers

Background and suggestions for designing usability and utility testing

Here we provide some background and suggestions to support our dciWebMapper users to prepare and design their usability and utility testing for their web map(s) applying our dciWebMapper framework.

Brief background

Utility describes what an interface can do and how useful the functionalities provided by the interface are for users to complete their objectives. Usability is how easy and pleasant these functionalities are for users to use. A successful visualization tool often has high usability and high utility (Grinstein et al., 2003), (Janicki et al., 2016). For a web map application (app), it is essential to consider users’ needs and expectations, because multi-dimensional spatial information can pose challenges for untrained users (Zuo et al., 2019). Roth et al. (2015) emphasized that the “user” should be given first attention before utility and usability. Roth et al. (2015) further proposed the Three U’s of Interface Success (see the figure below), which emphasize the importance of considering all three elements within user→utility→usability loops. The feedback also should be “in a loop” so that the web app is overseen in all stages (Roth & Harrower, 2008). Our GeoAIR Lab members have assessed the web apps developed for the case studies iteratively (i.e., repeatedly and often) during the development and design process to ensure the app’s usability. Although the feedback loop is applied, it is still important to do the utility and usability tests after completing the web app. Roth et al. (2017) emphasized the importance of comprehensive user-centered case studies, which provide consistent and detailed descriptions of designing and evaluating a given interactive map. This also is a significant way to produce transferable and contextual insights on interaction design and use. Section 2 below provides an exemplary plan to evaluate the case studies web maps for our dciWebMapper framework users to reference when they design their web map’s usability and utility testing.

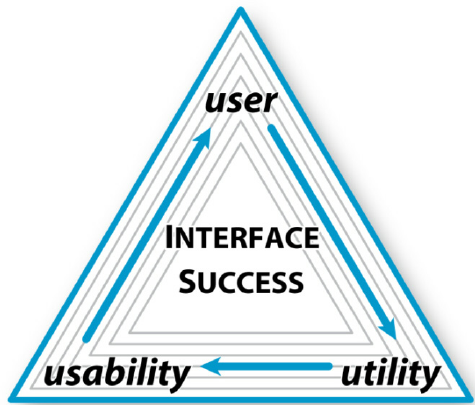
Figure 1. The Three U’s of Interface Success (Roth et al., 2015).

Exemplary experiment design plan

Usability testing does not require an enormous sample size; it often requires three to ten participants (Roth & Harrower, 2008). Research indicates that 5 users are enough to uncover 80% of usability problems (Virzi, 1992; Neilsen & Landauer, 1993). Some researchers suggest other numbers. For example, the experiment could recruit 20 participants across a university(e.g., students, faculty, and/or staff could be included in the participant pool). Participants would vary in age, background, computer skills, and/or previous experience in using and/or developing web maps. They would be randomly assigned to either the web mapping application group (first group, 10 participants) or no web mapping application group (second group, 10 participants). This would help ensure that any performance differences are not due to pre-existing differences between the two groups. The first group will participate in the experimental usability testing of the web map applications by applying our dciWebMapper framework. The main purpose of the second group is for comparative usability testing. The participants in the second group could use the traditional method (the dataset used for the web map applications, without the web map app interface) to complete the same tasks. For iTRELISmap, the second group is asked to use the TRELIS website to search for scholars and complete the tasks. The experiment will include quantitative and qualitative questionnaires.

Usability testing does not require an enormous sample size; it often requires three to ten participants (Roth & Harrower, 2008). Research indicates that 5 users are enough to uncover 80% of usability problems (Virzi, 1992; Neilsen & Landauer, 1993). Some researchers suggest other numbers. For example, an experiment could recruit 20 participants across a university(e.g., students, faculty, and/or staff could be included in the participant pool). Participants would vary in age, background, computer skills, and/or previous experience in using and/or developing web maps. They would be randomly assigned to either the web map app group (first group, 10 participants) or no web map app group (second group, 10 participants). This would help ensure that any performance differences are not due to pre-existing differences between the two groups. The first group will participate in the experimental usability testing of the web map apps using our dciWebMapper framework. The main purpose of the second group is for comparative usability testing. The participants in the second group could use the traditional method (the dataset used for the web map apps, without the web map app interface) to complete the same tasks. For iTRELISmap, the second group could be asked to use the TRELIS website to search for scholars and complete the same tasks from the first group.
An exemplary draft of quantitative and qualitative questionnaires is designed by using the iTRELISmap web application as an example.For the qualitative questionnaires, we suggest the following tasks we designed (note that the difficulty level of the tasks varies):

Task 1: Please find the name(s) of the scholars who joined TRELIS in 2021 or 2022 and are currently working in Chicago.
Task 2: Please find scholar(s) who currently work in Ohio and GIS is one of their research interests; for each found scholar, please also provide all of their research interests listed on their Google Scholar pages.
Task 3: Please find email contact for scholar(s) who used to work at Esri.
Task 4: Please find the current institution and department of the scholar/scholars who focused on anthropology in their degrees.
Task 5: Please find mentor/mentors who work in California and are interested in GIS education.
Please write down your suggestions, comments, and any concerns you have.

All five tasks are suggested to follow with confidence and preference ratings:

− Overall, how confident are you that you completed the task successfully? Rate from 1 (not at all confident) to 5 (extremely confident)
− Rate your experience using our web application to finish this task. Rate from 1 (very unsatisfied) to 5 (extremely satisfied).

The following Likert scale questions (Likert, 1987) consist of ten statements from the standard questionnaires SUS (System Usability Scale) (Brook, 1996):

Statement 1: The web application was easy to use. (strongly agree, agree, neutral, disagree, strongly disagree)
Statement 2: The web application is unnecessarily complex. (strongly agree, agree, neutral, disagree, strongly disagree)
Statement 3: I wish resaerch organizations had an accompanying web application like this. (strongly agree, agree, neutral, disagree, strongly disagree)
Statement 4: I would need the support of a web mapping expert to be able to use this application. (strongly agree, agree, neutral, disagree, strongly disagree)
Statement 5: The various functions in this web application were well integrated. (strongly agree, agree, neutral, disagree, strongly disagree)
Statement 6: There was too much inconsistency in this web application. (strongly agree, agree, neutral, disagree, strongly disagree)
Statement 7: I would imagine that most people would learn to use this web application very quickly. (strongly agree, agree, neutral, disagree, strongly disagree)
Statement 8: I found the web application very cumbersome to use. (strongly agree, agree, neutral, disagree, strongly disagree)
Statement 9: I felt very confident using the web application. (strongly agree, agree, neutral, disagree, strongly disagree)
Statement 10 : I needed to learn a lot of things before I could get going with this web application. (strongly agree, agree, neutral, disagree, strongly disagree)

Exemplary experiment result analysis plan

Usability Metrics for Effectiveness: Effectiveness can be calculated by measuring the completion rate. Referred to as the fundamental usability metric, the completion rate is calculated by assigning a binary value of ‘1’ if the test participant manages to complete a task and ‘0’ if he/she does not. The completion rate is a simple and intuitive metric and it can be collected during any stage of development (ISO 9241-11:2018). Effectiveness can thus be represented as a percentage by using this equation:


Usability Metrics for Efficiency: Efficiency is measured in terms of time used to complete a task (ISO 9241-11:2018). The time taken to complete a task can then be calculated by simply subtracting the start time from the end time as shown in the equation below:

Time for Task Completion = End Time – Start Time


Time-based efficiency will be calculated by using the following equation:
where N is the total number of tasks (goals); R is the number of users; nijis the result of task i by user j; if the user successfully completes the task, then Nij = 1, if not, then Nij= 0; tij is the time spent by user j to complete task i. If the task is not successfully completed, then time is measured till the moment the user quits the task.

The overall efficiency will be calculated by using the ratio of the time taken by the users who successfully completed the task in relation to the total time taken by all users (ISO 9241-11:2018). The equation is represented as follows:
where the notation of the symbol are the same as in formula of Time Based Efficiency above

Usability Metrics for Satisfaction: The SUS scores (Brook, 1996) of the participants will be calculated to measure perceptions of usability. The 95% confidence intervals (CI) for the results will be obtained with the SUS questionnaire, answered with a five-point Likert scale. The closer to five the score in each statement of the questionnaire is, the better the web application has been experienced by the participants, except for statements 2, 4, 6, 8, and 10, for which a score closer to one is better. The results of the questionnaire presented averaged by factors (intention to use again, perceived learning utility, perceived easiness of use) will be calculated to analyze if the web application is satisfying and usable.

We suggest combining these results to derive usability statements for the web applications. Based on the results, conclusions could be drawn about the effectiveness and usefulness of web mapping applications.

References

Brooke, J. SUS-A quick and dirty usability scale. Usability Eval. Ind. 1996,189, 4–7.

Grinstein, G., Kobsa, A., Plaisant, C., Shneiderman, B., & Stasko, J. T. (2003). Which comes first, usability or utility? Visualization Conference, IEEE, 112–112.

iso.org. 2018. ISO 9241-11:2018(en) Ergonomics of human-system interaction — Part 11: Usability: Definitions and concepts. [online] Available at: https://www.iso.org/obp/ui/#iso:std:iso:9241:-11:ed-2:v1:en (Last accessed on 7 July 2024).

Janicki, J., Narula, N., Ziegler, M., Guénard, B., & Economo, E. P. (2016). Visualizing and interacting with large-volume biodiversity data using client–server web-mapping applications: The design and implementation of antmaps.org. In Ecological Informatics (Vol. 32, pp. 185–193). https://doi.org/10.1016/j.ecoinf.2016.02.006

Nielsen, J., & Landauer, T. K. (1993, May). A mathematical model of the finding of usability problems. In Proceedings of the INTERACT'93 and CHI'93 conference on Human factors in computing systems (pp. 206-213).

Roth, R. E., & Harrower, M. (2008). Addressing Map Interface Usability: Learning from the Lakeshore Nature Preserve Interactive Map. In Cartographic Perspectives (Issue 60, pp. 46–66). https://doi.org/10.14714/cp60.231

Roth, R. E. (2015). Interactivity and Cartography: A Contemporary Perspective on User Interface and User Experience Design from Geospatial Professionals. Cartographica: The International Journal for Geographic Information and Geovisualization, 50(2), 94–115.

Roth, R. E., Çöltekin, A., Delazari, L., Filho, H. F., Griffin, A., Hall, A., Korpi, J., Lokka, I., Mendonça, A., Ooms, K., & van Elzakker, C. P. J. M. (2017). User studies in cartography: opportunities for empirical research on interactive maps and visualizations. International Journal of Cartography, 3(sup1), 61–89.

Virzi, R. A. (1992). Refining the test phase of usability evaluation: How many subjects is enough?. Human factors, 34(4), 457-468.

Zuo, C., Liu, B., Ding, L., Bogucka, E. P., & Meng, L. (2019). Usability Test of Map-based Interactive Dashboards Using Eye Movement Data. In LBS 2019; Adjunct Proceedings of the 15th International Conference on Location-Based Services/Gartner, Georg; Huang, Haosheng. Wien.